On December 9th, 2025, we did something no engineering team enjoys: we shipped a commit that disabled our client's flagship feature. The national map view — the first thing every user saw — was simply turned off.
It wasn't a bug. It was a decision. The map had hit a wall that no amount of tweaking would move, and keeping it limping along would have been worse than pausing it and rebuilding the foundation underneath. This is the story of that rebuild: five months, three architectural generations, and a map that now loads in seconds what once took a minute — or didn't load at all.
Our client operates under NDA, so you won't find their name or product here. Everything else — the architecture, the numbers, the mistakes — is real.
The setup
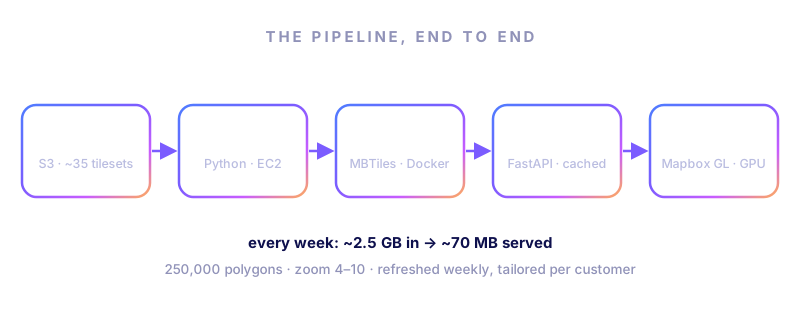
The platform we built visualizes a weekly-refreshed dataset covering the entire United States at census block group resolution — roughly 250,000 polygons, each scored across about 35 thematic dimensions, every single week. Users pan a map, pick a theme, switch weeks, filter by audience segment, and expect the whole country to respond like a native app.
That last sentence is the entire difficulty. Each requirement on its own is routine. Together — national scale, weekly refresh, dozens of switchable layers, per-customer tailoring — they compound into a genuinely hard delivery problem.
Act I: The GeoJSON wall
The first version did the obvious thing. The backend returned polygon geometries as WKT strings; the frontend parsed them into GeoJSON and handed them to Mapbox GL as a plain data source. For a single state, this worked fine.
Then users zoomed out.
At national scale, the browser was being asked to download, parse and render a quarter of a million polygons as raw JSON — per theme, per week. Load times stretched past 30 seconds. Memory ballooned. We tried caching state-level geometry in IndexedDB, deferring loads, trimming payloads. Each fix bought a little time and changed nothing fundamental: the data model was wrong for the scale.
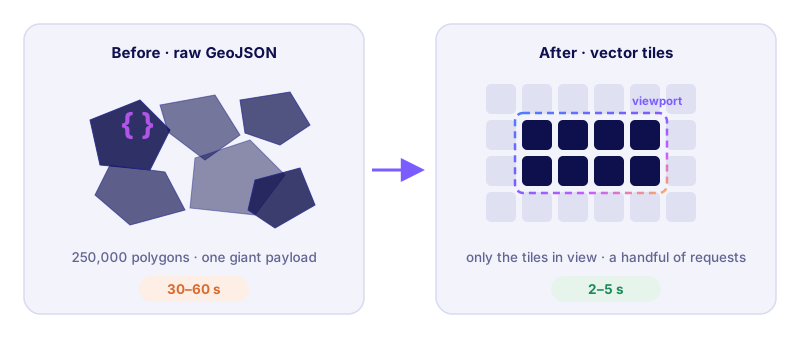
So we turned the national view off, and gave ourselves permission to solve the real problem.
Act II: Eleven days to a tile server
The fix had a name we already knew: vector tiles. Instead of shipping raw geometry, you pre-cut the country into a z/x/y pyramid of compact, binary MVT tiles — MBTiles on disk — and the map only ever requests the handful of tiles in view.
The real question was where those tiles should live. Hosted tilesets are comfortable — someone else's uptime, someone else's CDN — but a dataset that changes completely every week would live inside someone else's upload pipeline, on someone else's schedule. Self-hosting meant owning uptime, but also owning the refresh loop end to end. We chose ownership, with a concrete target written down before any code: the full country, a quarter of a million polygons, first paint under ten seconds.
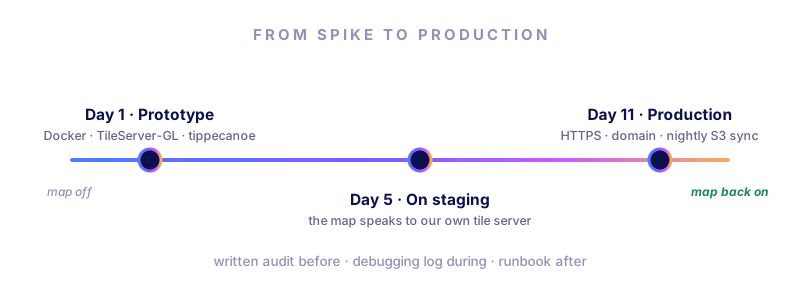
What happened next became a pattern we now use deliberately: the written spike. Before committing to the architecture, we wrote an audit document in the repository — current approach, its limits, the proposed design, measurable targets. During the spike we kept a running issues log: our first TileServer-GL container crash-looped on every request, and the log accumulated seven checked-off debugging steps before we found stable ground. Those documents still live in the repo. When a new engineer asks why it is built this way, the answer isn't tribal knowledge — it's a file with a date on it.
The timeline still surprises us:
- Day 1: first prototype — Docker, TileServer-GL, a tippecanoe script, a test page.
- Day 5: merged to staging; the map component now spoke to our own tile server.
- Day 11: production — HTTPS, a proper domain, an EC2 host, and an automated S3-to-server sync with a state file, disk-space prechecks and a nightly cron.
Self-hosting also taught us its own folklore, the kind you only learn at 11 p.m.:
- SQLite journal files. A processing run leaves -wal and -shm sidecars next to the database; a tile server running as a different user tries to open them, fails, and restarts in a loop. The fix is two lines — match the container user, delete the journals before restart.
- Container paths are not host paths. The server's config must reference the path inside the container mount, not on the host. It's written down in three places now, because it bit us more than once.
- URL-encoding is part of the contract. Tileset IDs containing slashes must travel percent-encoded — in the server config, in the frontend URL builder, everywhere. One inconsistent layer and nothing resolves.
Each of these is one line in a runbook now. Each cost us an evening first.
Act III: Thirty-five tilesets walk into a browser
Vector tiles fixed rendering. They did not fix arithmetic.
The dataset ships as one tileset per theme per week — about 35 files, roughly 2.5 GB weekly. The platform's signature view asks a question that spans all of them at once: for every neighborhood in America, which theme scores highest right now? Answering it honestly meant the browser loading 35 tilesets and comparing them client-side. Load time: 30–60 seconds. We had rebuilt the old wall out of newer bricks.
Our first instinct was to stay on the beaten path: tippecanoe's tile-join can merge tilesets. But merging just stacks layers in one file — it can't decide anything. No off-the-shelf tool could look at a polygon, compare 35 scores and keep only the winner. So we wrote one.
To write one, it helps to know what a vector tile actually is: a tiny protobuf database — layers of features whose coordinates are integers on a 4,096-step grid inside the tile. MBTiles wraps thousands of those tiles in a single SQLite file, storing rows bottom-up in TMS order while the web requests them top-down in XYZ, so every read flips the Y coordinate. And the decoder and encoder must agree on which way Y points: get that wrong on one side only, and the entire United States renders mirrored. We know, because we watched it happen.
The processor decodes every vector tile, and for each of the 250,000 polygons picks the top-scoring theme — then re-encodes a single-layer tileset that answers the question directly. The output schema is where it gets interesting: alongside the winner, we store the names of ranks two to five as plain properties. That one modeling decision means the frontend can re-color the entire country by “second-place theme” with a pure Mapbox GL match expression — a GPU operation. No JavaScript touches a single feature. Switching ranks is instant.
The processor went through six generations in about three weeks, and the sequence is a compressed course in data engineering:
- Naive: load everything into memory. Worked on samples, died at national zoom levels.
- Parallel: fan out with multiprocessing. Faster, still memory-bound.
- Merge-first: pre-merge the inputs, process one file. Simpler input, same ceiling.
- Streaming: the breakthrough — iterate the SQLite tile cursor directly and hold nothing. Peak memory: 50–100 MB, regardless of input size.
- Direct: skip the merge entirely; read the per-theme files in lockstep.
- Segmented: bake four audience-segment variants of every score into the same tileset, so one file powers a whole segment switcher — again restyled purely on the GPU.
The streaming rewrite is also where the unglamorous database work lives: write-ahead logging on the output file, synchronous writes off for the duration of the run, a 500 MB page cache, a commit every few thousand tiles. None of it is exotic; together it is the difference between a job that finishes overnight and one the kernel kills at 3 a.m.
One more thing the long runs taught us: a five-hour job you can't see is a horror movie. Every run logs a progress line per batch — tiles done out of 21,861, elapsed time, output size, error count — and we watched from three angles: a tail on the log, a small script polling the process over SSH every minute, and cloud CPU metrics from a browser shell when no terminal was near. The finish line is a literal DONE in the log. Boring observability, consistently applied, is what let us run several of these across different weeks without anxiety.
The production run that validated it: 21,861 tiles, zoom levels 4–10, processed in 4.7 hours with zero errors on an 8-vCPU machine — deliberately pinned to six workers so the tile server sharing the box stayed responsive. And the result users feel:
~2.5 GB → ~70 MB. Thirty-five layers → one. 30–60 seconds → 2–5 seconds.
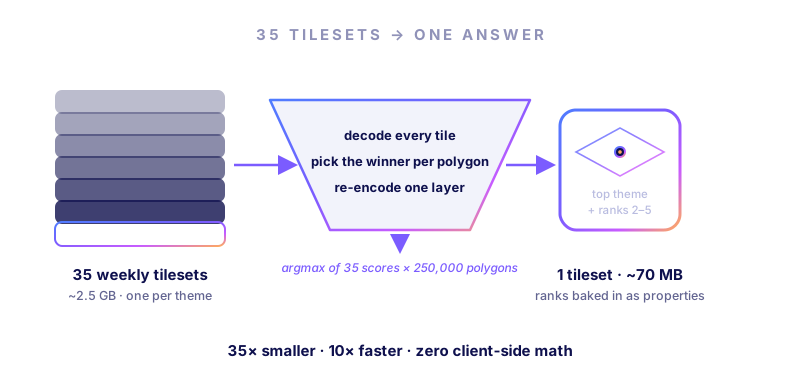
A 35× size reduction, from choosing the right question to pre-compute.
Act IV: Monthly tiles that don't exist
Weekly data creates a product question: what does “this month” look like? The obvious answer — batch-generate monthly tilesets — creates four new pipelines' worth of storage, sync and staleness. We went the other way.
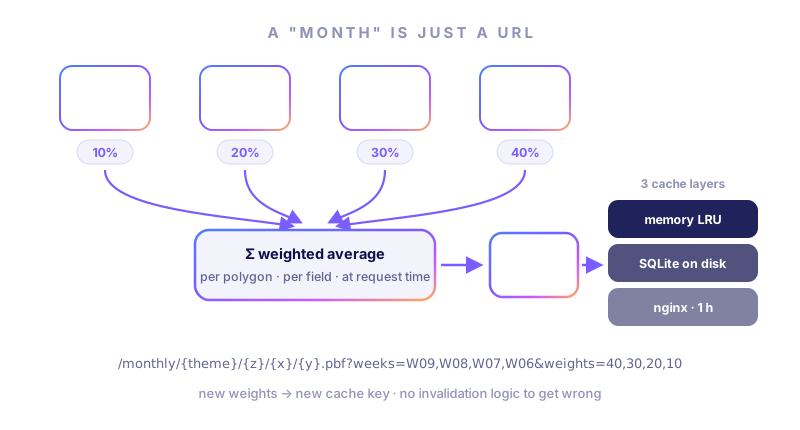
We built a small FastAPI proxy that synthesizes monthly tiles at request time. A “month” is nothing but a URL: a list of weeks and a weight vector:
/monthly/{theme}/{z}/{x}/{y}.pbf?weeks=W09,W08,W07,W06&weights=40,30,20,10
Under the hood, every request runs a four-phase pipeline:
- Read. Open each week's MBTiles read-only, in parallel — one indexed lookup per file for the requested tile.
- Decode. Sniff the compression from the first bytes (some files are gzip, some zlib, some plain), then decode the actual vector-tile protobuf.
- Merge. Bucket features by polygon id and compute the weighted average per field. If a field exists in only three of four weeks, the weights are re-normalized over those three — a data gap can't silently drag a neighborhood's score down.
- Encode. Re-encode one layer, gzip, serve with the right headers. The browser never learns the tile didn't exist five hundred milliseconds ago.
Three details we're fond of:
- The weights are a product control, not an engineering constant. An admin screen lets the client tune the week-weighting; the next tile request simply computes with the new weights. Data science can experiment without a deploy.
- Cache keys do the bookkeeping. The key hashes theme, sorted weeks, weights and coordinates. Sorting weeks means two orderings share an entry; including weights means every experiment is automatically its own cache namespace. There is no invalidation logic to get wrong — a new configuration is a new key.
- Three cache layers, honest telemetry. In-process LRU, on-disk SQLite (hits get promoted back to memory), and nginx in front. A health endpoint reports hit and miss counters, and every merge logs its phase timings. When a merge is slow, we know exactly which phase to blame.
Two production notes worth stealing. First, the reverse proxy in front grants these requests generous timeouts — a cold, country-wide tile at low zoom can legitimately take tens of seconds to merge, and treating that as a failure would only re-trigger the work. Second, CORS headers live in exactly one layer of the stack. They used to live in two, and the resulting duplicate-header bug is now a comment in the config file so nobody reintroduces it.
The part that makes this a favorite: the merge algorithm wasn't written for the service. It was lifted from the batch processor of Act III. The same code that once ran as a five-hour offline job now answers HTTP requests — batch logic promoted to request time, because the caching made it affordable.
Act V: One platform, many customers
The quietest piece of the architecture is the one the client's team touches most. Every dataset — each week, each content package, down to individual data snapshots — carries independent staging and production availability flags, managed from an admin panel. The same build serves both environments; a hostname check decides which flags apply.
The consequence is easy to state and hard to overvalue: data releases are decoupled from code deploys. A new week of data arrives Friday; the client's team reviews it on staging in the production build, then flips it live with a toggle. No deploy, no release train, no engineer in the loop. Rollback is the same toggle. Meanwhile personalization runs through the tiles themselves — the segment variants and affinity fields baked into every polygon mean a user's filter selections just change which properties the GPU expressions read. Tailoring without extra requests.
The frontend holds the last line of resilience, because tile servers have bad days too. Resolving a theme to a tileset runs two paths: first a fuzzy match against the tile server's own catalog — titles are normalized and compared by word overlap, and anything below a confidence floor is rejected, because a confidently wrong map is worse than a missing one. If the catalog is slow or the match too weak, a deterministic builder assembles the URL from the naming convention alone. Around both sit timeouts, exponential backoff, stale-response guards, a per-week metadata cache — and a loading state machine whose phases (fetching the catalog, matching, loading tiles, ready) are shown to the user as honest progress instead of a spinner of unknown intent.
Act VI: Ship less, overzoom more
The current iteration inverts the usual instinct once more. Instead of generating every zoom level from 4 to 12, we are moving to sparse tilesets — only zoom 4 and zoom 8 — and letting Mapbox GL overzoom: stretching the nearest available tile over the missing levels. Since the polygons are already neighborhood-sized, the visual cost is negligible. The only load-bearing change on the frontend was honesty: tell the map source the real maximum zoom, so the renderer scales what exists instead of requesting what doesn't.
The arithmetic is brutal and delightful. A tile pyramid roughly quadruples per level: our zoom 4–10 build is ~21,800 tiles, and zoom 10 alone accounts for ~15,800 of them. Keep only zoom 4 and zoom 8 and you generate about 1,210 — roughly 94% fewer tiles to build, store and sync, every single week, multiplied across ~35 themes.
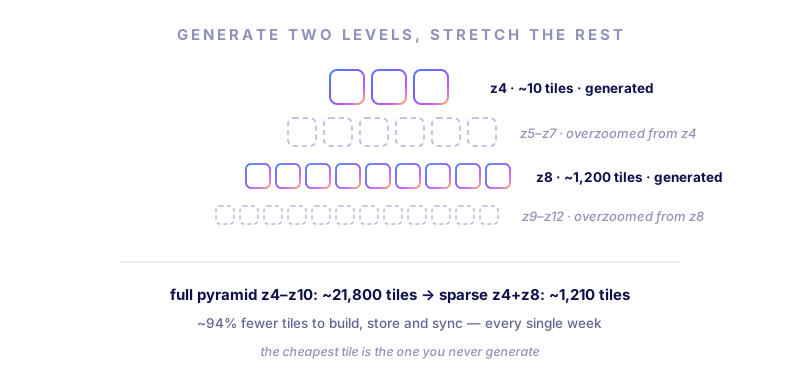
It's the same lesson as Act III wearing a different coat: the cheapest tile is the one you never generate.
What we'd tell you over coffee
- Turning a feature off can be the most productive commit of the quarter. It converts a slow bleed into a defined problem with a deadline.
- Write the audit before the rewrite, and keep the debugging log. Our docs folder is a decision journal; five months later, it wrote most of this article.
- Pre-compute the question, not the data. Every order-of-magnitude win came from moving a decision — top theme, rank order, segment variant, monthly blend — to the cheapest possible layer: offline, into the cache key, or onto the GPU.
- Own the boring parts. Self-hosted tile serving cost us some late-night folklore, but it is what made weekly refresh, request-time merging and instant data toggles possible at all.
- Small team, short loop. This was built by a very small team in about four and a half months from an empty repository — trunk-style development, spike branches for the risky parts, and product-owner toggles instead of release ceremonies.
The map is back on, national by default, and nobody thinks about it anymore. Which was the point.